Using Six Sigma for B2B Sales Funnel Management
Many of us in B2B marketing fret about the state of the funnel. What can we do to accelerate sales, opportunities, drive more leads?
Believe it or not, there is a great set of analytical tools at your fingertips that’s not just about attribution.
Yes, Six Sigma!
It’s not just for manufacturers or Fortune 100 companies either. Six Sigma provides a powerful toolkit to diagnose business processes—and the funnel is a business process—to attain real outcomes for your sales team.
What is Six Sigma and Why is it so useful?
Let’s learn about the process analysis and process management tools pioneered by GE and Honeywell and how to use them effectively for GTM operations and funnel analysis.
“Six Sigma is a set of methodologies and tools used to improve business processes by reducing defects and errors, minimizing variation, and increasing quality and efficiency. The goal of Six Sigma is to achieve a level of quality that is nearly perfect, with only 3.4 defects per million opportunities.”
Six Sigma is for any business process, not just manufacturing! MOPS KPIs often include defect rates and uptime, so it makes sense to leverage the toolkit that keeps planes flying to keep your GTM machine running smoothly.
The Six Sigma Toolkit
DMAIC
The DMAIC framework is helpful because it is often how Marketing Operations begins to work with Marketing to gain control of the funnel itself.
Define: what is the business problem and goal?
Measure: what shall be measured and how will we know we solved it?
Analyze: use the tools to understand the root causes, process, etc
Improve: how can this process be improved or tested?
Control: once launched, does the change stick? Is it working?
The 5 Whys
The Five Whys is likely the tool you are familiar with already. When confronted with a challenge, ask Why five times to dig into the root cause. This tool is like a Philips screwdriver – always have it and it helps you solve 80% of your problems.An example relevant to marketing operations could go like this:Problem: Marketing ROI went down unexpectedly.
Why? – Direct Sales Opportunities became Partner Opportunities [Proximate cause]
Why? – the system shows salespeople changing the Opportunity Record Type
Why? – Salesperson says she makes more commission off Partner Opportunities
Why? – Compensation plan shows Partner Opps give 100% to salespeople, while Direct Opps give 80%
Why? – Partner Channel was more important 5 years ago so it was incentivized differently.
The root cause analysis would show that the compensation plan is the root cause of the behavior.
Now we have a possible resolution to the investigation – can we change the Compensation plan to change Sales’ behavior? Certainly more questions would be asked of the Partner team and the sales compensation team before any change would be made.
What happens if we ask “Why” only two times? Is your solution different?
Why? – Direct Sales Opportunities became Partner Opportunities [Proximate cause]
Why? – the system shows salespeople changing the Opportunity Record Type
The root cause here is the salesperson making a change. Many people would then blame sales behavior and implement a system guardrail process, such as
Auto change the Opportunity back to Direct Type
Warn the salesperson
Disable salesperson’s ability to make this change
Would any of these adjustments change the behavior when we haven’t addressed the incentive? Likely not. The salesperson would become frustrated at the blocker and find a way around, or escalate it to the head of Sales.
The Fishbone Diagram (Ishikawa) or Root Cause Analysis (RCA)
When coupled with Five Whys, the Ishikawa diagram supports a full RCA. The framework allows you to breakdown a Problem into primary and secondary causes alongside symptoms of a Problem or cause. Coupled with the Five Whys, you can trace back the problem to its origins across the process.
It is recommended to use Ishikawa diagrams for thornier challenges where Five Whys does not completely reveal a path forward. In the Partner Opportunity example, it is possible to go deeper such as “Why are salespeople compensated like that?”
Variance Monitoring with Control Charts
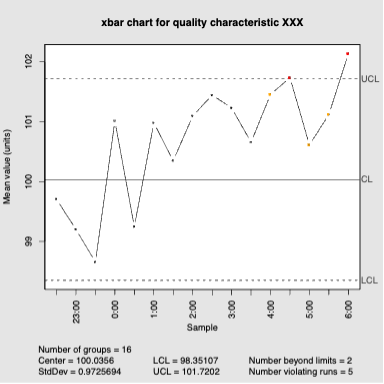
Control Charts are an important tool for monitoring everything from quality to funnel pipeline generation. These are sometimes called variance charts, run charts, or statistical process monitoring (SPM) charts. If you are managing a sales funnel toward a target each quarter, you must use a Control Chart – and you may already have something similar!
Such variance monitoring is used most often in manufacturing production. The key components are, for example:
Control Limit (CL) or Trailing mean, often TTM that we want this process to be around.
Upper Control Limit (UCL) – the maximum allowable variance from mean (or target).
Lower Control Limit (LCL) – the minimum allowable variance from mean.
Optional lines that could be used for early warning or investigation alarms can include:
Target Metric – if we want to move the mean to a new goal with continuous improvement.
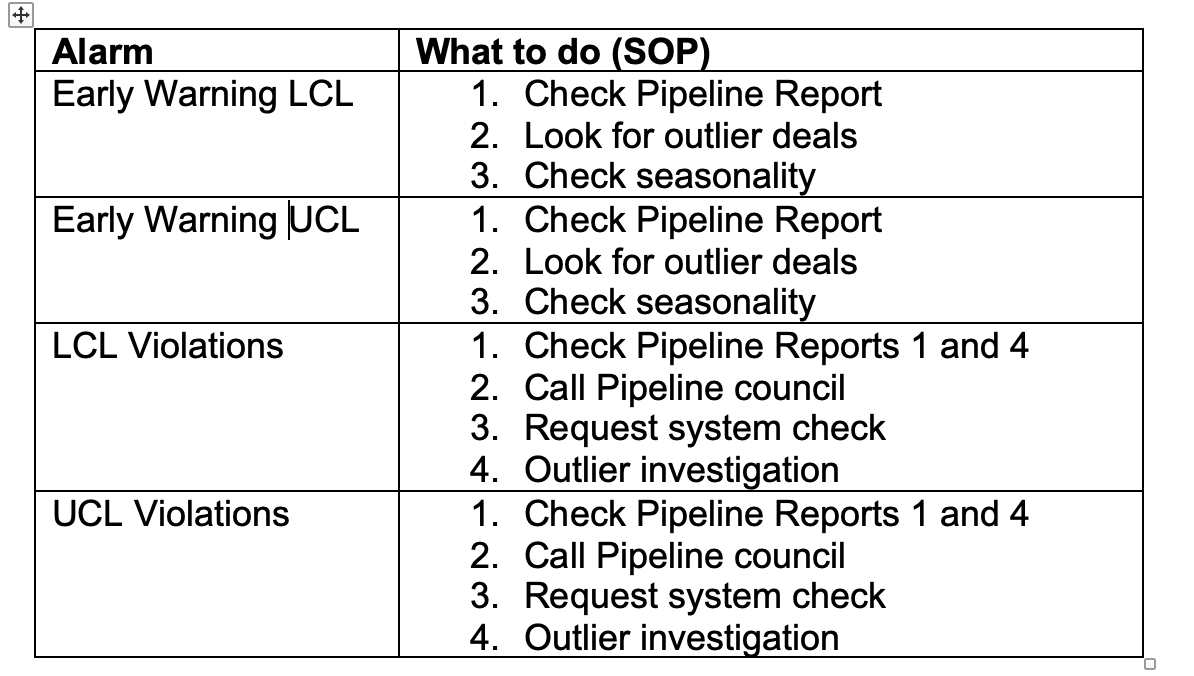
Early Warning UCL, LCL – if we want to begin investigating a break that is still within our tolerance band but should be checked out.
Figure 2. Example of a statistical process chart. DanielPenfield - Own work, CC BY-SA 3.0, https://commons.wikimedia.org/w/index.php?curid=9002304
The next use of such an SPM is to use a Standard Operating Procedure (SOP) if an Early Warning Limit or UCL/LCL is breached. For example:
Funnel management monitoring to maintain revenue goals could include KPIs such as:
Speed to Lead
Renewal Opportunities
CPQ approval times
Deal Desk approval times
Variance monitoring is a crucial tool for any process you manage from data integrations all the way to renewal management.
Using Six Sigma to Manage the Funnel
Diagnosing funnel and revenue issues can be challenging in a fast-paced environment where teams may lose real money on the outcome. Using Six Sigma’s tools, you can better monitor funnel metrics and resolve blockages or declines faster.
Think of several scenarios that may come up every day.
Pipeline is down
Demos shot up but Opps did not
Web Chat entries quadrupled but Opps did not
Customer 90 day churn is trending up
Event leads aren’t converting to Opps
Forecast model said we’d see 22% over target while actuals was 5%.
The first, and easiest step is to ask “Why?” in each of these scenarios. Five Whys may help you reach the root cause fastest, although if the answer is not forthcoming, then move to Fishbone and Process Analysis.
Let’s take one example like 90 Day Churn Trends.
Five Whys
1. Why?
a. Dashboard showing 90 day churn is trending 10% above TTM average, going from 2.3% to 2.5%.
2. Why?
a. SMB segment appears to drive most of this churn
3. Why?
a. Increase in SMB sign ups last quarter.
4. Why?
a. Marketing ran a promotion of a 30% discount.
5. Why?
a. Market had a goal to increase SMB sign ups 15% over last quarter.
Now there is an understanding of the motivation and a possible root cause. There isn’t a clear reason this cohort is driving higher churn, however, so further Whys may be needed to uncover what may be multiple causes. Possible paths to explore:
Do SMBs churn at a higher rate on average?
Did implementation process get overwhelmed?
What reasons did the SMBs give for leaving?
What is required for an SMB to be successful and stay?
Another example could be that 47% of ecommerce customers cancel by the 30 day guarantee
Map out the purchase process, screens, etc
Ask Why does the customer do X?
Ask Why do we ask this of the customer?
Number Porting takes 4 days – Why?
What do customers say when they leave?
Result – steps to buy were reduced by 2 screens; implementation process down to 2 hours from 4 days.
As you can see, using one or more of the Six Sigma analysis tools can help you identify root causes of funnel issues and lead you to a solution that lifts revenue quickly.


